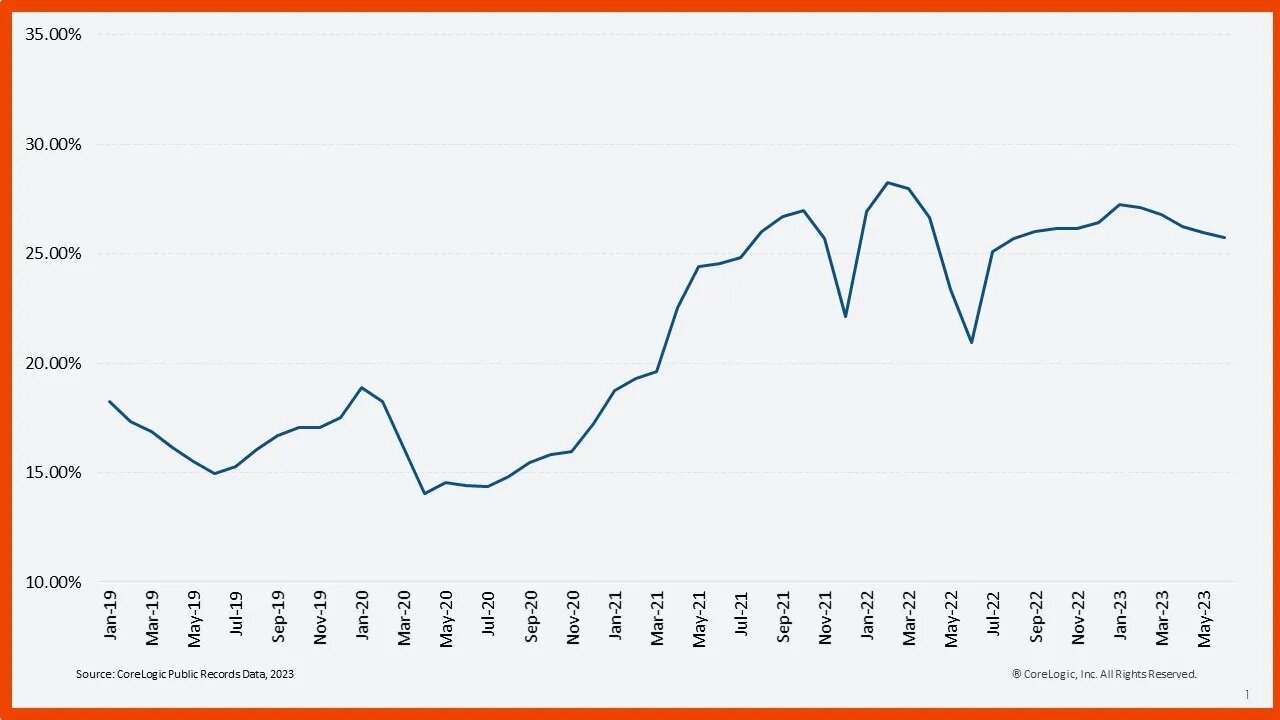
According to national data provider CoreLogic, the sizable U.S. home investor share of ownership seen over the past two years held steady going into the summer of 2023. In March 2023, investors accounted for 27% of all single-family home purchases; by June, that number was almost unchanged at 26%.
Corelogic reports that 2021 saw a surge in investor activity. Investors have since held a market share that averages 8 percentage points higher than in 2020. Investor activity has declined slightly since early 2023, but there is still no sign that the share will fall back to its pre-pandemic level in the near future. Indeed, the most likely reason for the small drop in home investor purchases in recent months is seasonality, as owner-occupied buyers become more active in the summer.
The investor share measures investor purchases compared with owner-occupied buys, and though the data shows a stark difference pre-pandemic compared with today, examining the number of transactions offers a more comprehensive picture.
In April, May and June of 2023, home investors made 85,000, 98,000 and 82,000 purchases, respectively. Over the course of the second quarter, this was an annual decline of 90,000 purchases. However, when compared with the same months in 2019, the increase in home investor activity rose by more than 43,000. When comparing that number with non-investors, who made 392,000 fewer purchases in Q2 2023 than in Q2 2019, it becomes clear how different the current market is than it was in the previous few years.
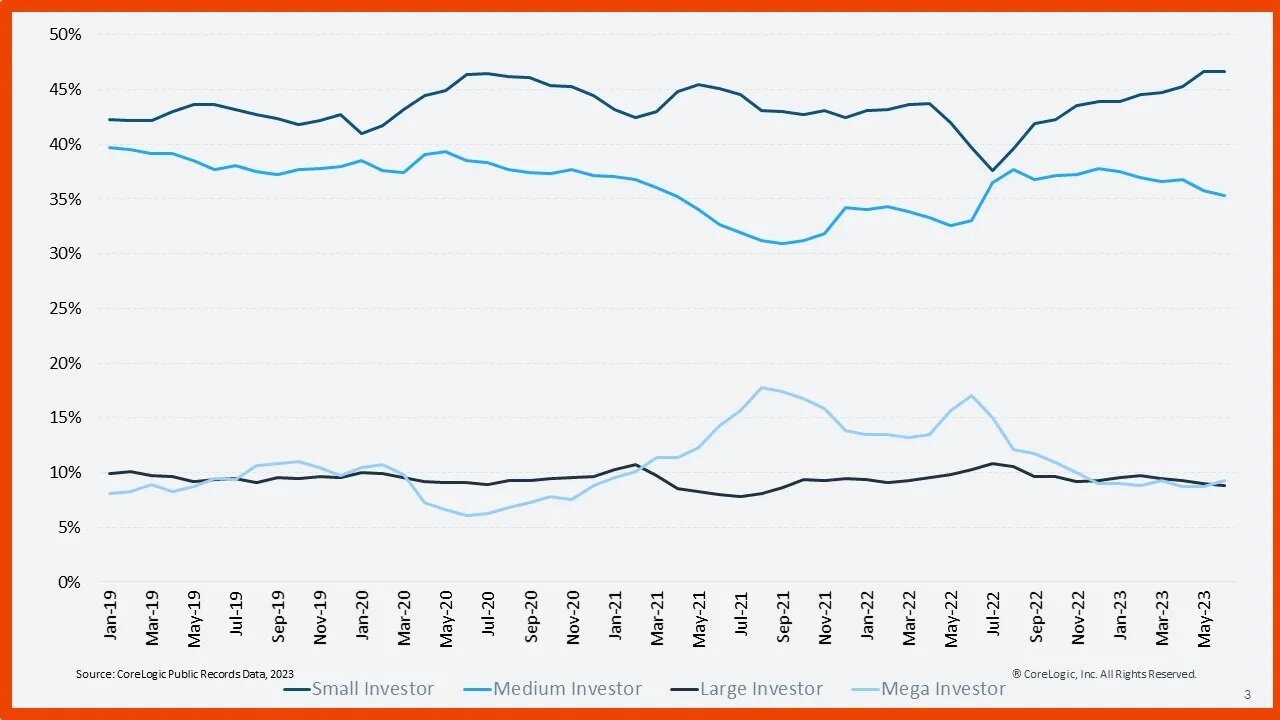
As the total number of investor purchases declines, smaller investors are growing their market share. Corelogic says throughout 2023, mega-investors (those that own 1,000 or more properties) and large investors (those that own 100 to 999 properties) have both held market shares of between 8% and 10% in each month. In the case of mega-investors, this is a drastic decline from the high of 17% of all investor purchases recorded in June 2022. Medium investors (those that own 10 to 99 properties) saw a modest decrease in activity, from 37% to 35%.
Typical housing market investors are becoming more and more likely to operate on a smaller scale (owning three to nine properties). In June, this group accounted for 47% of investor purchases, the highest level since 2011, according to CoreLogic data.
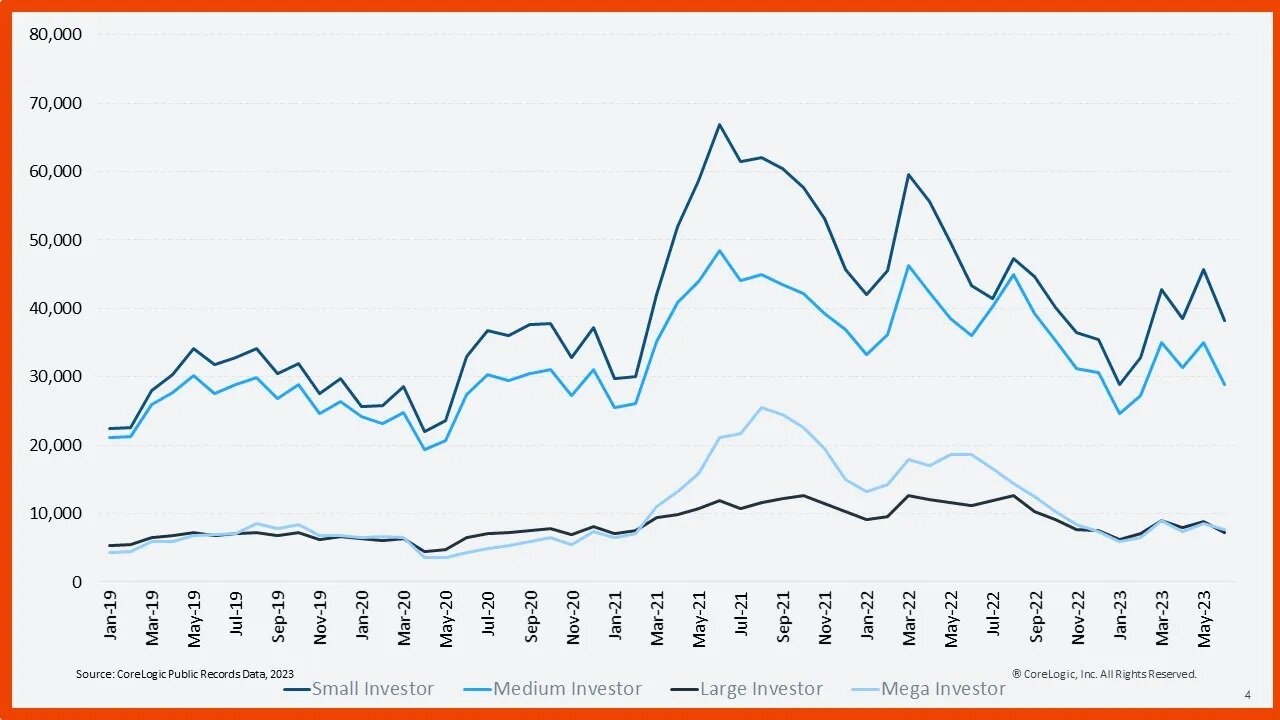
Throughout Q2 2023, large and mega-investors showed muted activity. In April, May and June, mega-investors each made between 7,000 and 9,000 purchases per month, numbers that are consistent with those recorded before the home investor surge began in 2021.
Small investors made 38,000, 46,000 and 38,000 purchases in April, May and June, respectively. Though these are big drops from 2021 and 2022, they are still above 2019 and 2020 levels. In those years, the April, May, and June numbers were respectively 30,000, 34,000 and 31,000 (2019); and 22,000, 23,000 and 32,000 (2020).
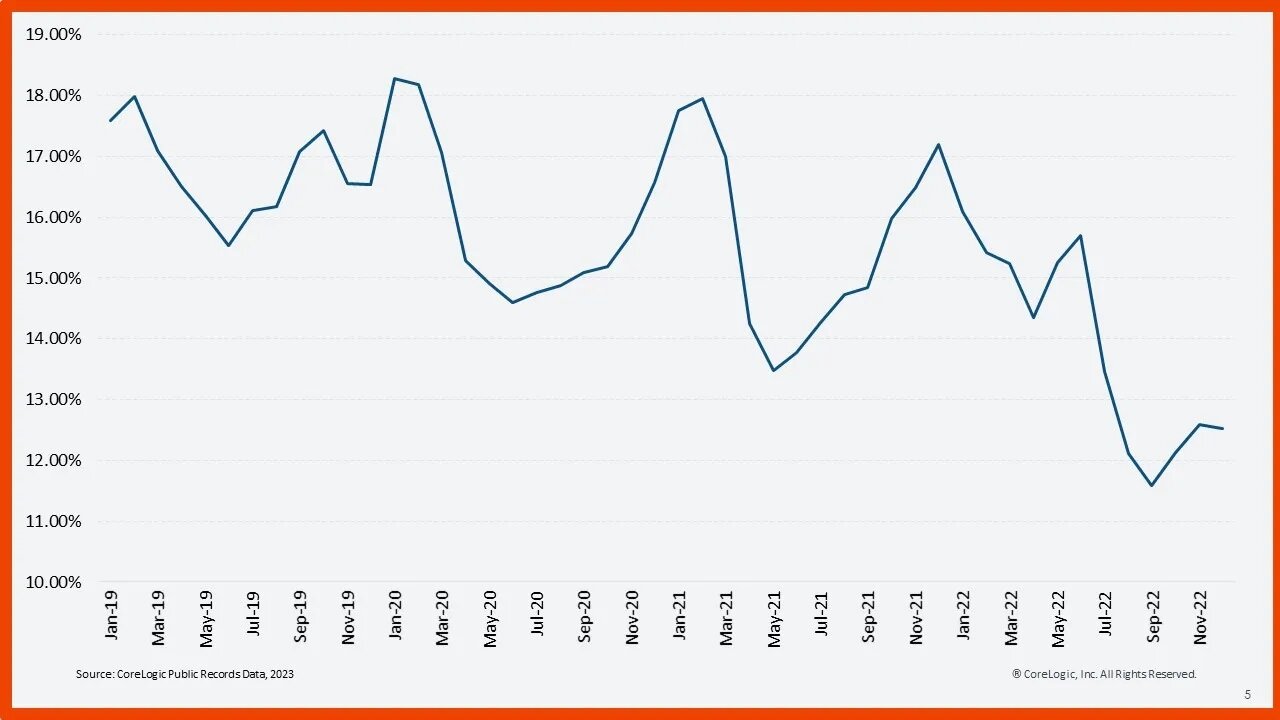
In the second half of 2022, home-flipping activity lagged. Only 12% of investors that purchased a home in December 2022 resold that property by the end of June 2023. This is a lower share than seen in previous years but a slight increase from the 11% recorded three months earlier.
This data point indicates that the decline in home flips may have bottomed out since such transactions are tightly connected to price appreciation, and home prices have slowly recovered in the past few months. So, we should expect the flip rate to rise slightly in the near future, says CoreLogic.
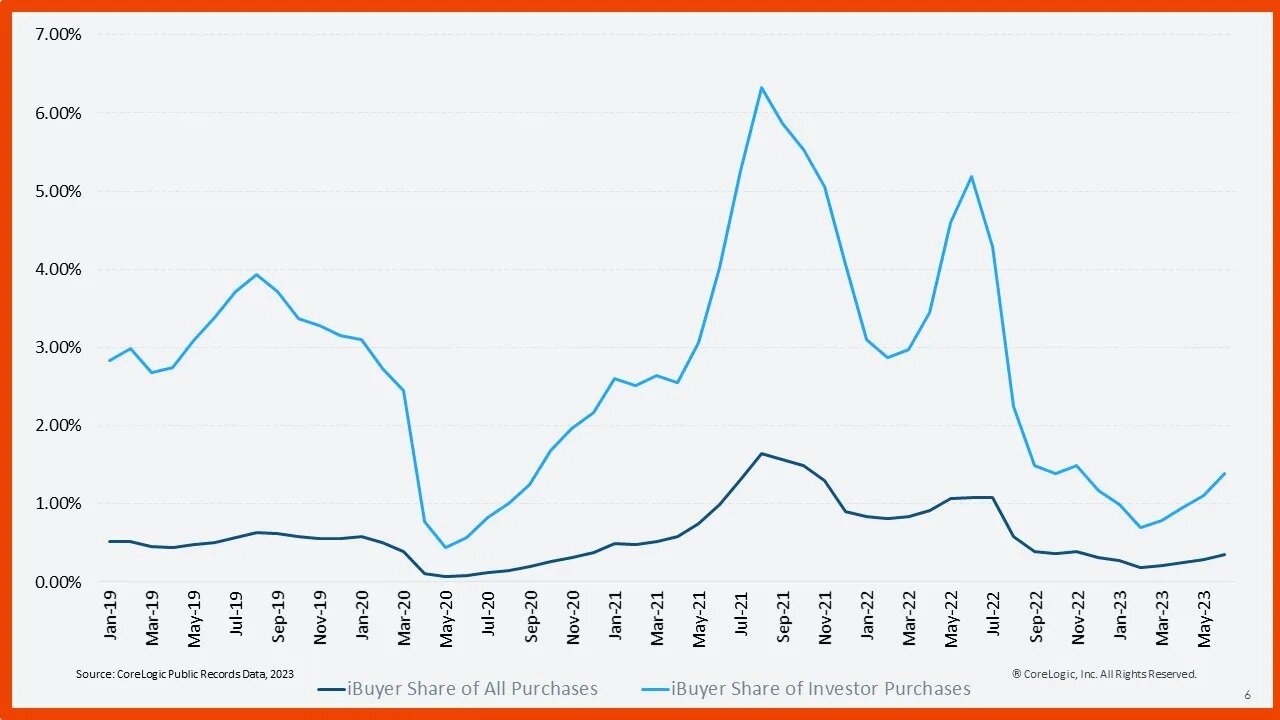
Evidence that the flipping rate could rise is predicated on a slight uptick in iBuyer purchases in the last few months. Corelogic says iBuyers accounted for only 0.7% of all home investor purchases in June 2023, but that activity rose in the subsequent months to 1.4%. Rebounding appreciation in the past few months is likely the source of this shift, and since iBuyers are essentially specific types of house flippers, this increase could foreshadow an increase in the overall flip rate.
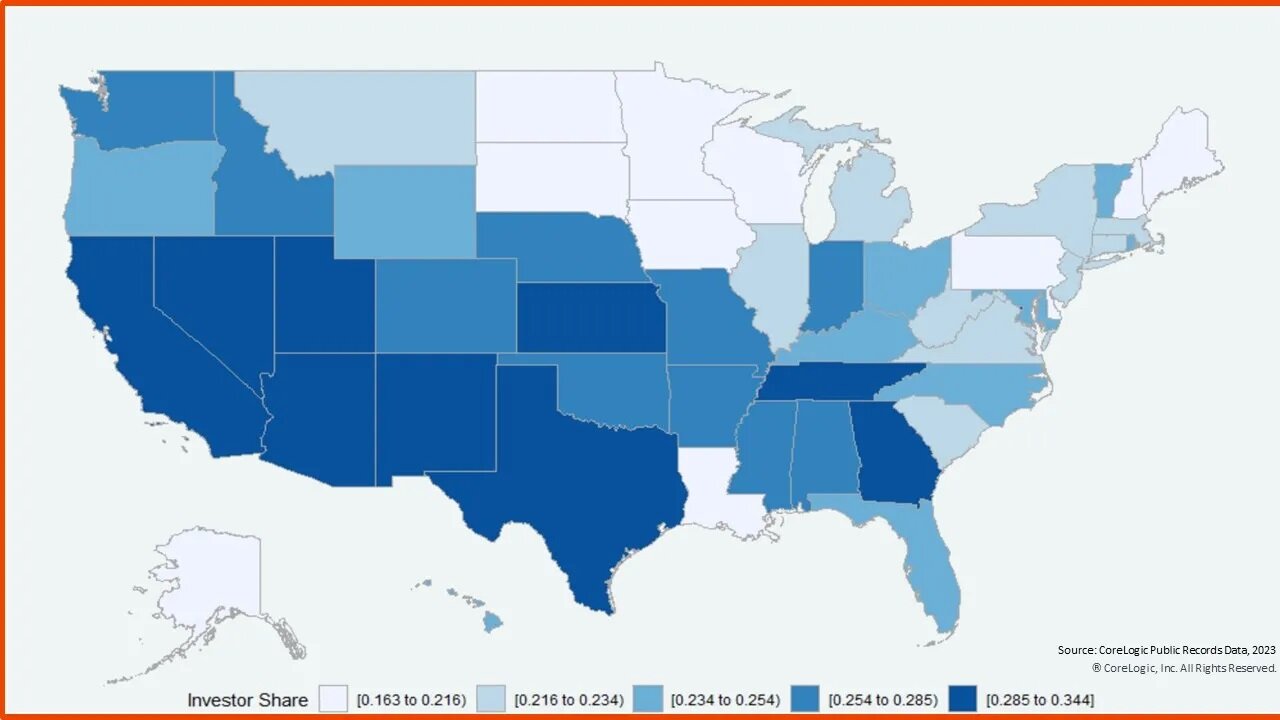
Home investor shares were concentrated in Western, Southern and lower Midwestern states in Q2. Figure 7 shows this trend, with California (34%), Washington, D.C. (33%), Georgia (32%), New Mexico (31%), Texas (31%), Nevada (30%), Utah (29%), Arizona (29%) and Kansas (29%) posting the highest investor share. Washington, D.C’s significant gain is somewhat surprising, given investor share in nearby areas. In fact, the District of Columbia’s investor share was 10 percentage points higher than its neighboring states of Virginia (23%) and Maryland (22%).
Though CoreLogic’s data shows the usual summer dip in home investor activity, there are no indicators that it will regress to pre-pandemic levels of less than 20%. Elevated interest rates and slowing appreciation seem to have dissuaded large and mega-investors, while small investors have stepped in to fill the gap.
CoreLogic says inventory levels continue to be constrained, partially because many owners are unwilling to sell and give up the low interest rates that current borrowers secured by refinancing during the pandemic. This trend could potentially be behind the rise of small investor activity in recent months, as members of this group may have chosen to rent their properties rather than sell. Rising demand for rental properties is translating to increasingly unaffordable rates and gives investors a good reason to stay (relatively) more active in the market than owner-occupied buyers.

